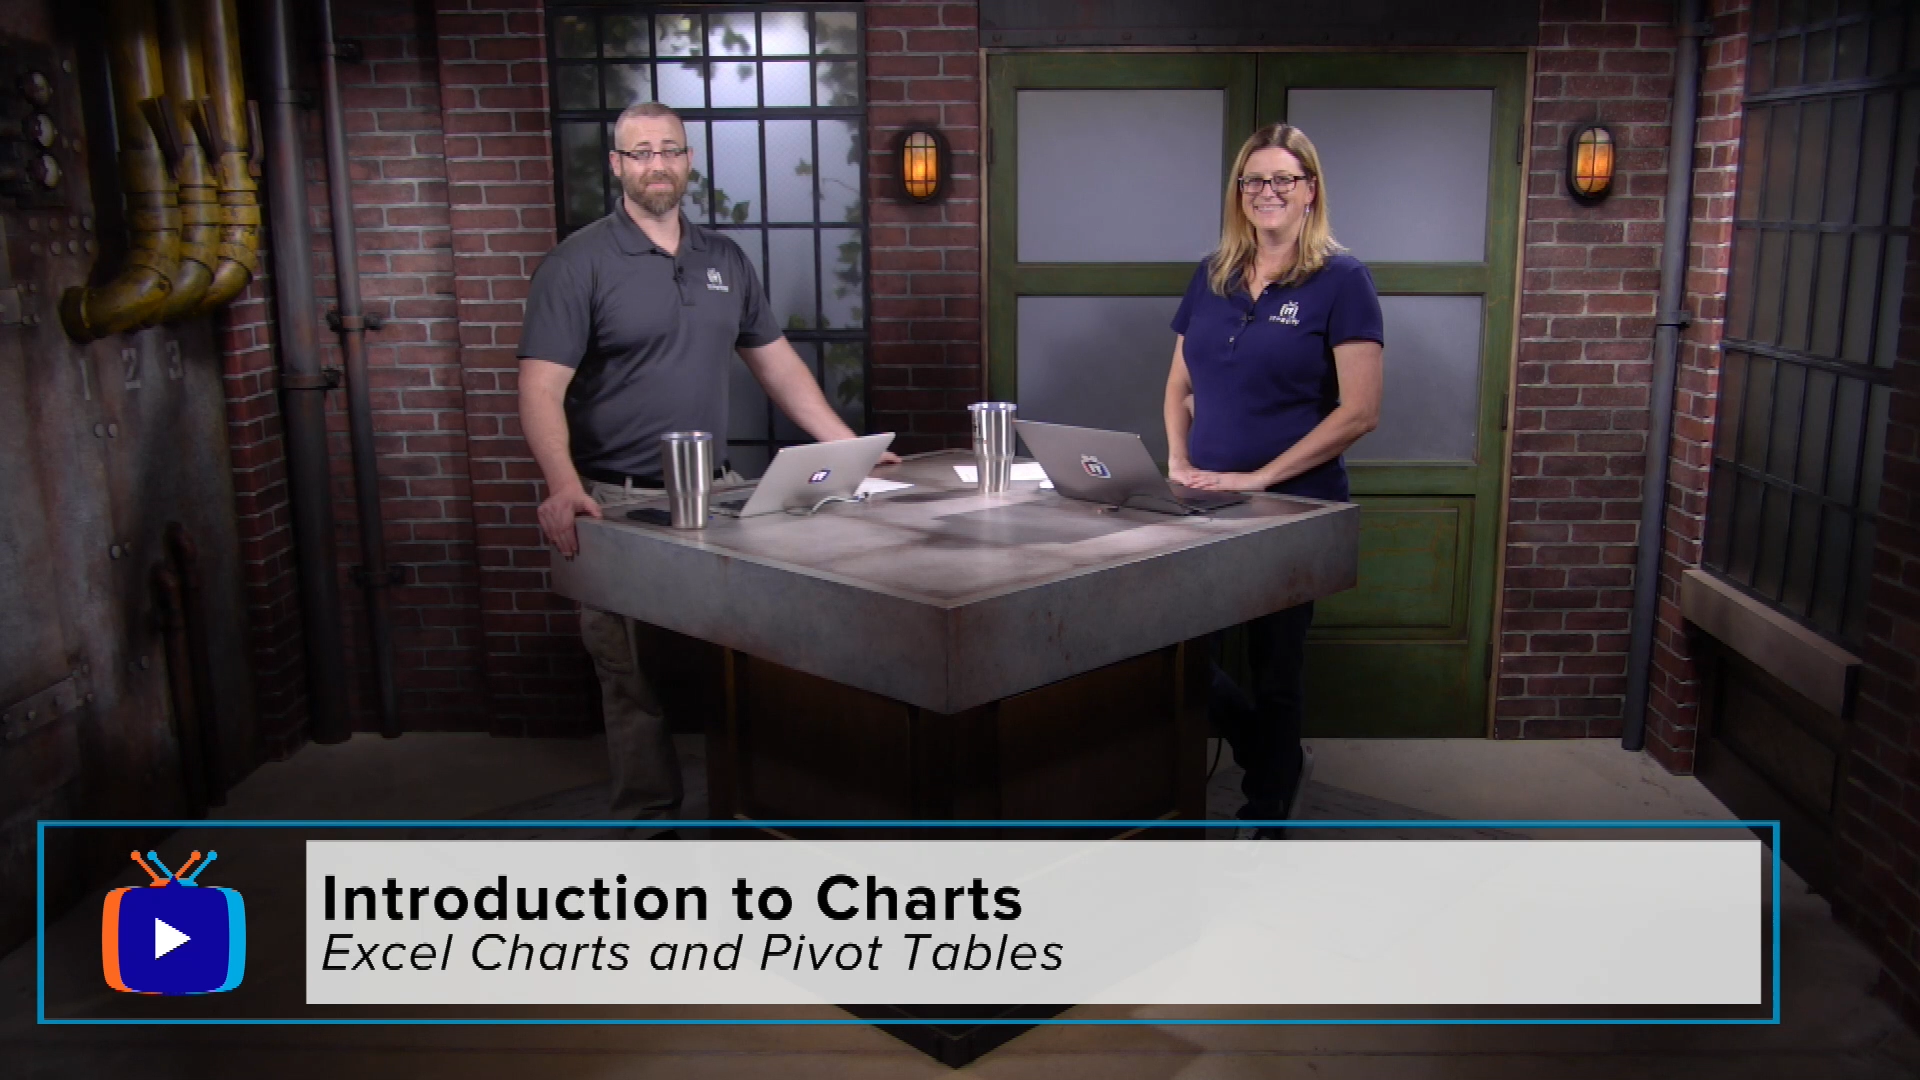
Excel Charts and Pivot Tables
 Length: 3h 28m
 Episodes: 8
Can you create a chart from the Excel data for our report? Can you make a dashboard? Oh, we also need a pivot table. These are requests that can make Excel users quiver in fear. In this series, we simplify how to create charts, PivotTables, and PivotCharts. We start from the beginning with identifying terminology used with charts and advance to creating complex PivotTables and PivotCharts. This series is specifically for locally installed Excel 2016 on Windows operating system.

Excel Charts and Pivot Tables Overview
Level Up with Unlimited Learning
Premium
BEST VALUE$59/month
Best for certifications + hands-on labs
- 7,000+ hours of IT & cybersecurity training
- Skill Labs + practice tests
Standard
$39/month
Video-only access
- 7,000+ hours of IT & cybersecurity training
Course Topics
OfficeProTV
Modules in this Course
- Charts
- Pivot Tables and Pivot Charts
Level Up with Unlimited Learning
Premium
BEST VALUE$59/month
Best for certifications + hands-on labs
- 7,000+ hours of IT & cybersecurity training
- Skill Labs + practice tests
Standard
$39/month
Video-only access
- 7,000+ hours of IT & cybersecurity training


